We’ve finished our first trimester of travel, so I figured it was a good time to share some fun graphs and data since several of you had commented or messaged me that you’d find that interesting. Plus, I know many of you are also engineers being our former coworkers and what engineer doesn’t love a good graph? It will be fun to see how this changes by the end of the year!
By The Numbers
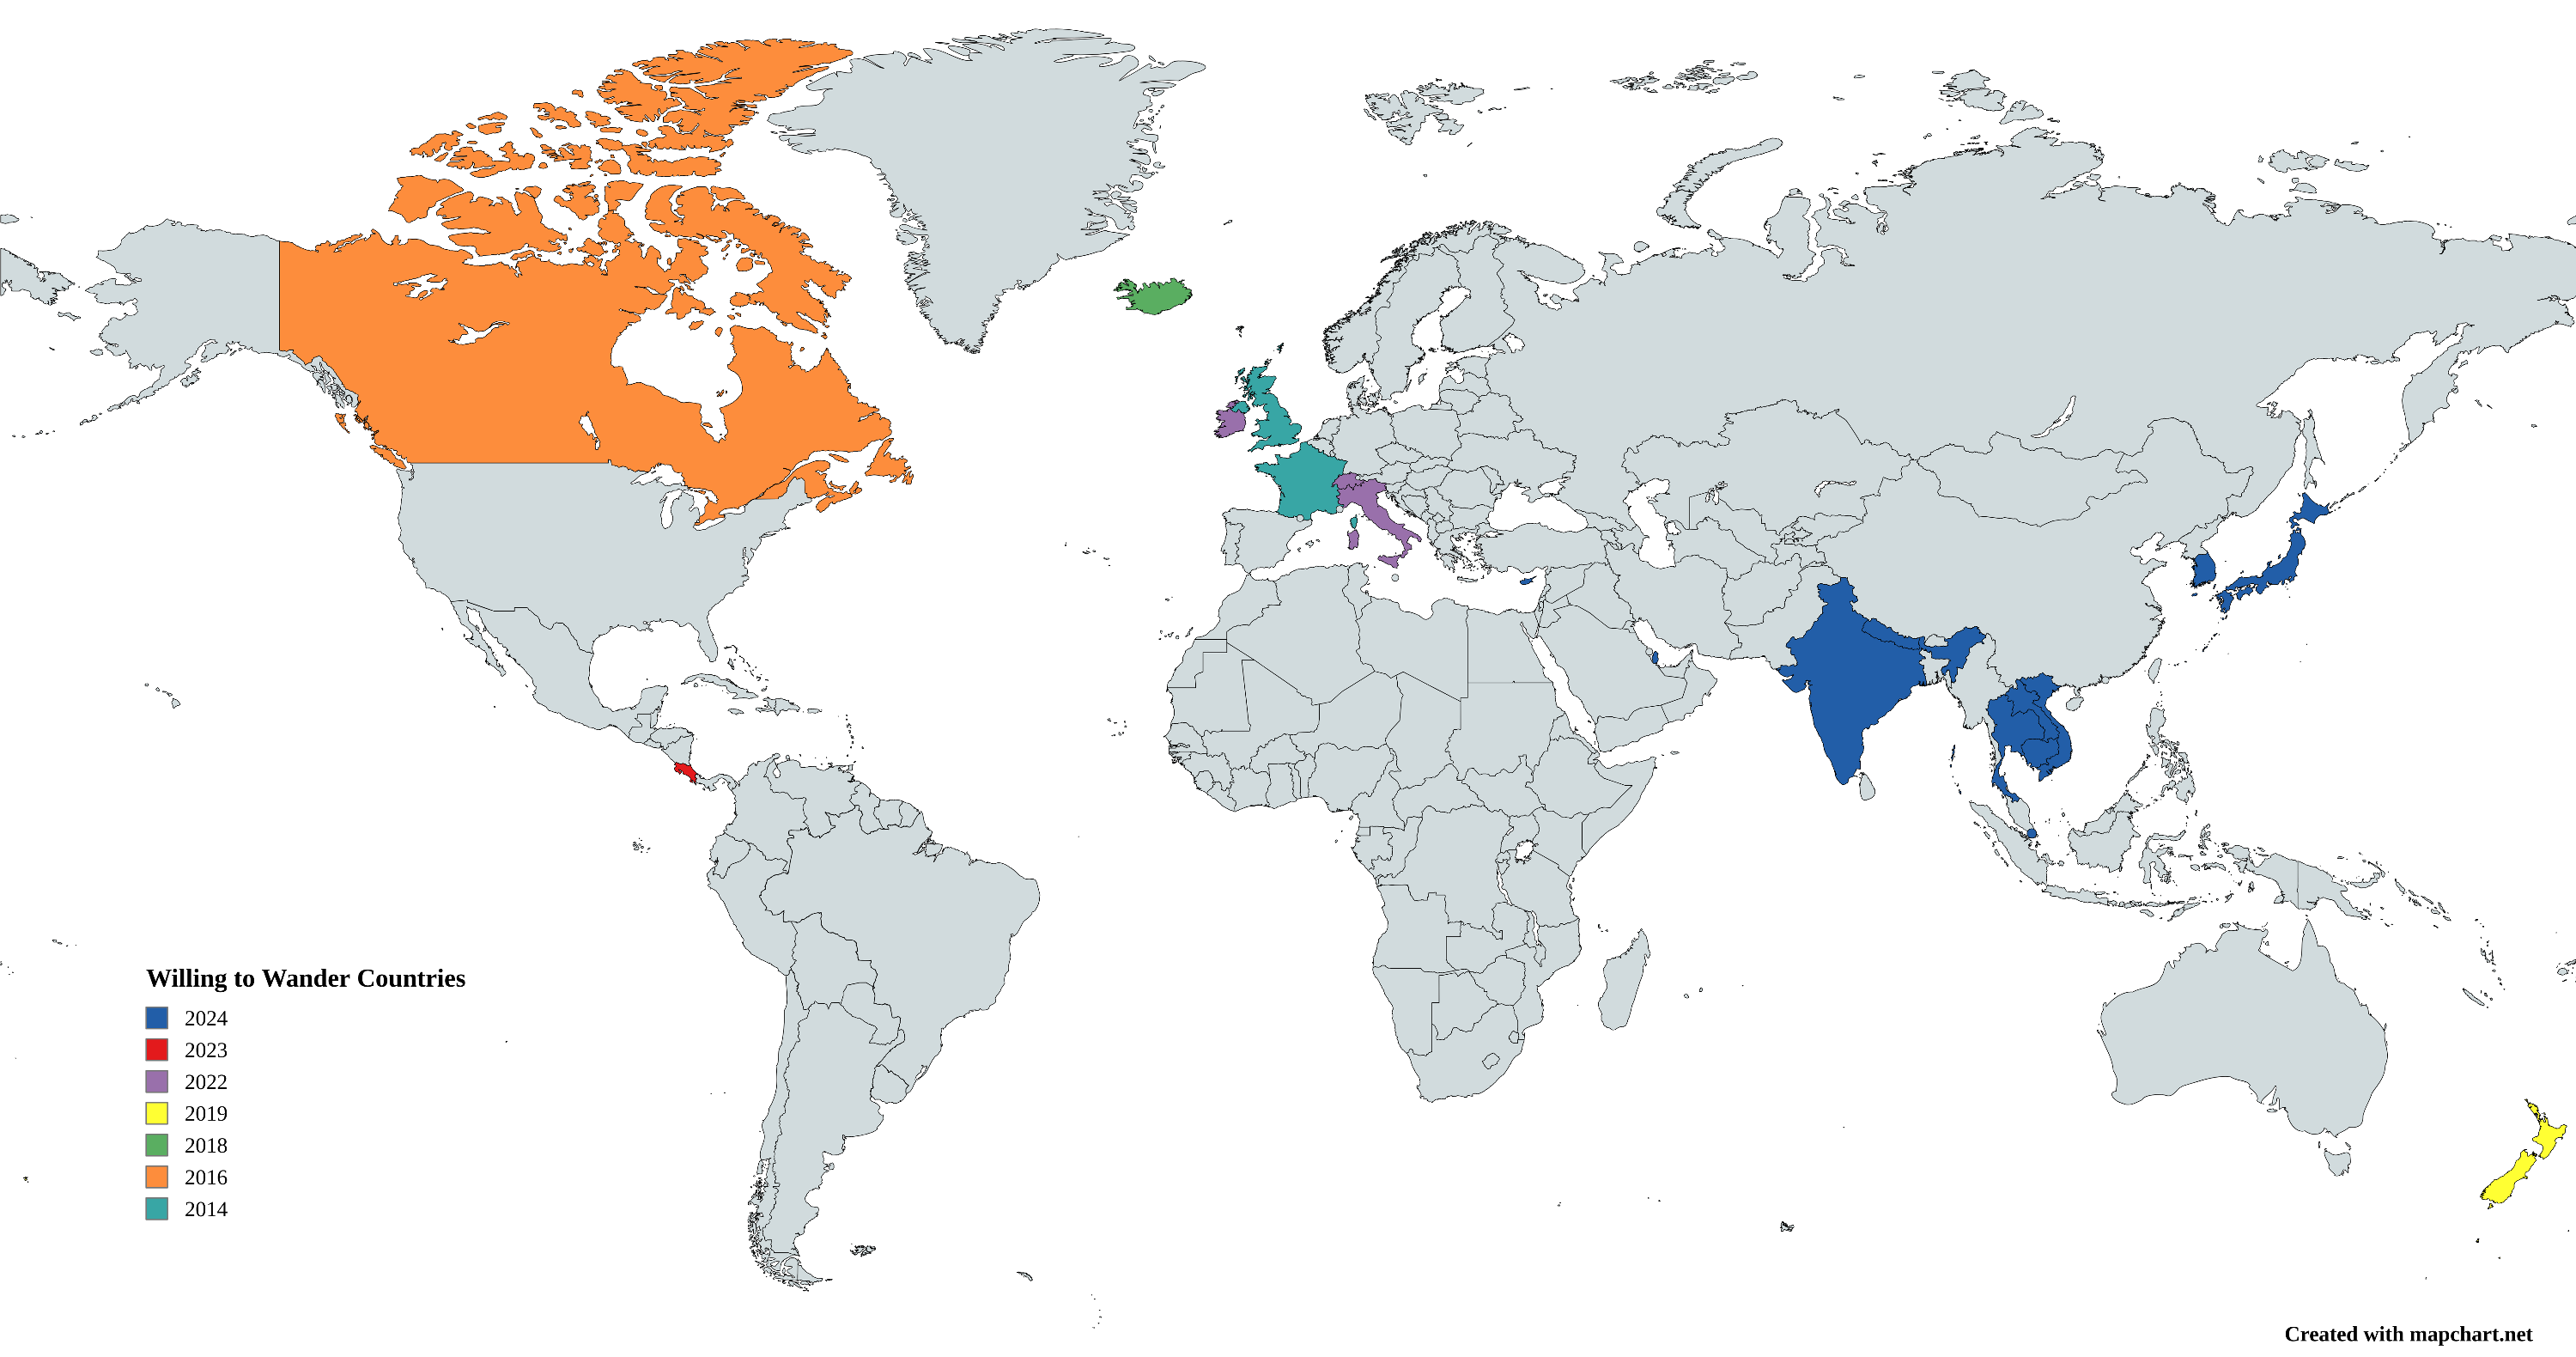
Alright, let’s start with a bit of an overview and take a look at all the countries that both of us have traveled to together. If it included where either of us went, especially Mr. Wander, there would be quite a bit more color in Europe, South America, and Africa.

The blue is the key for 2024 and accounts for 10 new countries out of a total of 21 since we started dating back in 2013. From the day we left on December 27th, until the last day in Cyprus on May 3rd, there is a total of 129 days of travel. We’ve spent the most time in Japan, Thailand, India and Nepal and the least in our two stopover countries of Singapore and Qatar.
| Country | Days |
|---|---|
| Japan | 29 |
| Thailand | 21 |
| India | 21 |
| Nepal | 21 |
| Vietnam | 11 |
| Laos | 6 |
| South Korea | 6 |
| Cambodia | 5 |
| Cyprus | 5 |
| Singapore | 2 |
| Qatar | 2 |
Most of the countries we’ve discussed about wanting to spend more time in are at the bottom of the table. Singapore really sticks out because we barely got to see much of anything. Qatar and Cyprus are similar but we didn’t have the energy to see what we maybe could have in that time. Laos is another one that would be nice to visit a few other cities but I could go back to Luang Prabang again as well. Japan and Thailand are also high on the list to return though too, especially the northern part of Japan on the island of Hokkaido we didn’t make it to at all.

It is amazing to think we’ve traveled that many miles already! To put that in perspective, the circumference of the earth at the equator is about 24,900 miles. Most of it is by plane, and out of 25 flights, 7 of them are over 1000 miles. The longest is the nearly 6000 mile journey from Minneapolis to Tokyo way back in December, and the shortest was Pune to Mumbai at only 77 miles. We’ve also managed to just have 2 layovers since we turned 2 others into stopovers.

As I said above, there have been 129 nights, any guesses how many different beds we slept on? 61! That’s an average of changing rooms every 2.1 nights! With the hike in Nepal that definitely helped skew the numbers but the longest we ever stayed in one place is 7 nights in a row, which was on Koh Lipe in Thailand. We have had a variety of bed types but the most prevalent were hotels. Other notable locations include a temple, a train, two boats (Vietnam & Japan/Korea ferry), two overnight flights, and the Nepali teahouses (which one could consider as a hotel or hostel). Twenty of the nights we have managed to pay by points redemption.
Bloggable Data Snacks

Back when I was concerned how wordy I was in the first few posts I started pulling the word count from each one. I shouldn’t have been concerned at all, I have nearly 3 times that many words in each of the posts about Nepal! One could go in depth and analyze the number of days each post covers to see how many words, on average, I write about each day. One could and one did.

I’m tempted to dig a little deeper to see if there were any particular countries for which I was more wordy, which at this point might mean I’m more excited, or I have more energy at the time of writing… but I will spare you. My average per day is actually trending down (blue) but I think that aligns with the number of days in each post trending up (red). I know this also has to do with me wanting to reduce the time from when something happens to when I am posting about it. And yes there’s one more graph…

Since I’ve been trying to keep to a weekly schedule, I consciously tried to keep both India and Nepal to 2 posts each. That way I had 4 posts to talk about 6 weeks of travel and succeeded in reducing the delay. I don’t have a specific goal in mind on what I’d like it to be but I know I don’t intend on posting within 7 days but I like the idea of keeping it less than a month.
Next Time…
I hope you all enjoyed the data, let me know if there’s anything specific you were curious about that I missed! You can comment below or send me an email! We do plan on sharing the costs of where we’ve gone but we’re just not ready for that yet. It’s tracked of course but we don’t know how exactly we want to present it, and it should involve a conversation on travel hacking, meaning using the miles and points for flights or hotels.
Next up in terms of travel is to a new continent for me and a new country for both of us, Egypt! It was good we had a bit of time in Qatar and Cyprus to get used to the hot weather again. See you all next week!

Leave a Reply